Gross Domestic Product
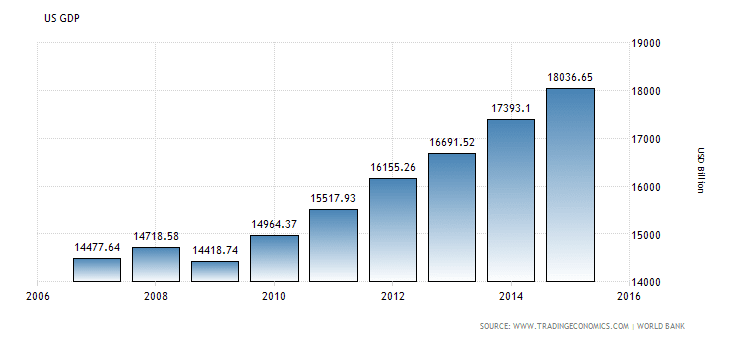
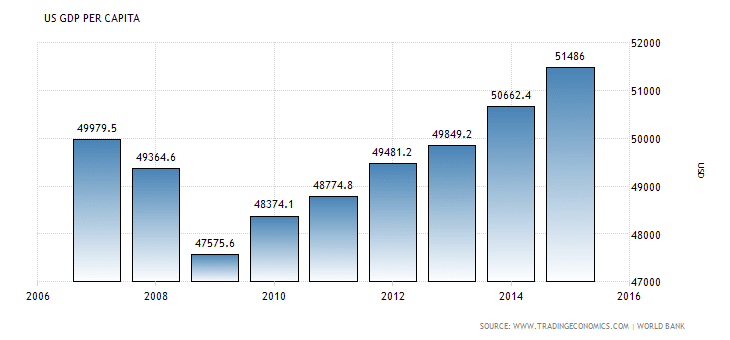
Until 2013, GDP of Norway began rising in 2009 with 363.38 billion USD and reached the peak in 2013 at 522.75 billion USD. The years following 2013, GDP has been decreasing. In 2013, Norway reached their highest GDP ever but when it began to drop, it fell a lot. GDP in 2015 was 388.31 billion USD, which is about 140 billion drop within 2 years. It took 4 years for the GDP to grow about 140 billion and it dropped nearly the same amount in 2 years. While in the US, GDP has only been rising since 2009 with 14.418 trillion USD, which is about 40 times larger than of Norway. While the GDP of both countries are pretty similar, GDP per capita can show more specifics and differences. In Norway, GDP per capita began dropping until 2012 where it suddenly rose. But even after 2012 to 2013, it also dropped until 2014 when it rose higher and now keeps rising. GDP of US is the same as the overall GDP, since 2009 it has only been rising.
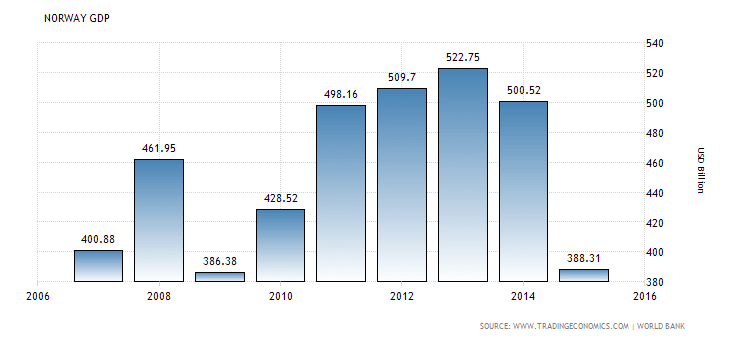
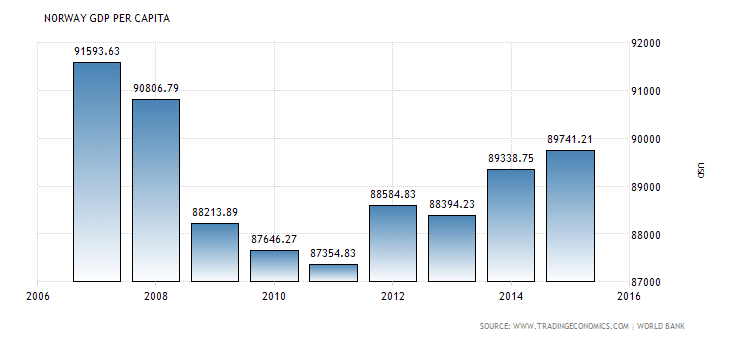
The GDP or Gross Domestic Product of Norway has always been well of with only a few bumps along the recent road, but where Norway really shines as an economy is their GDP per capita. World bank places Norway as the fourth highest GDP per capita in the world while bigger countries like US and the UK list 8 and 14 respectivel. Those bigger more populated countries are going to have more money compared to them, but Norway will have a better "per capita". This means for the country that while they dont make the most money they are able to distribute it the best
Taxation Policy
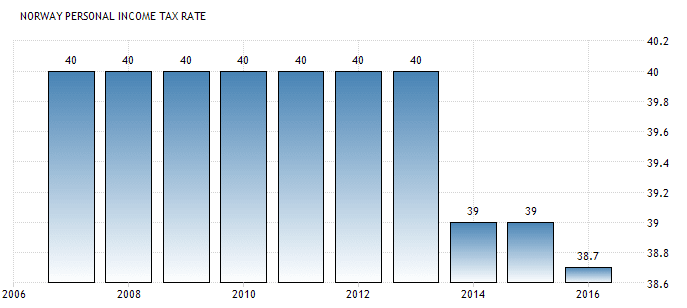
Norway has a Flat rate taxation policy. Tax rate has stayed the same from 2007 at 40% until 2014 where it had dropped to 39 and soon dropped to 38.7% in 2016 the total tax burden can amount to 45% of the total GDP of the country, which is twice that of the US. But with taking all of these taxes the local governments are able to supply the people with free healthcare, schools and better roads. Norway also has a policy called the WEALTH TAX which is an inforced law that taxes more heavily on purchasing power but not necissaraly their income, it is in place so that there isnt more poor people or more rich people. The people of norway are overall some of the most happy people and it may or may not be due to taxes, so is tax really a bad thing?
Economic Sectors
Norway distributes their economy in a very interesting way, just like its neighboring countries ie; Sweden and Finland. The agriculture used to be a big part of the economy but as years went on it become heavily industrial and serviced, and now those two sectors are about equal. Industry is 45.1% of the economy and service is 52.7% which leaves agriculture at a mere 2.2%. Industry would include electricticity power plants, factories and for Norway the entire oil industry of Norway. Services would include electric companies, cable companies and so on, and finally agriculture would include exactly what you think farms of all kinds.
Economic Growth Overview
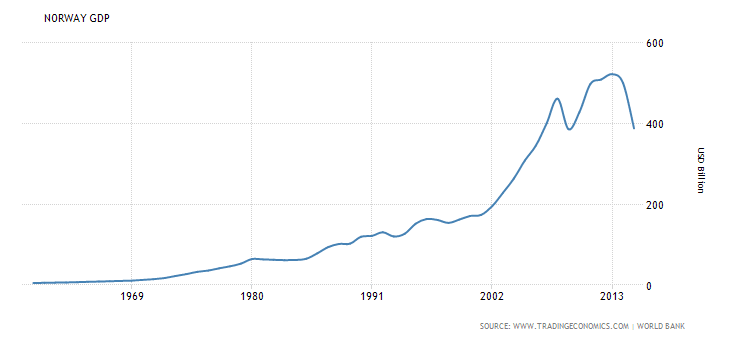
From 1969 to 2002, Norway’s GDP seems to be expanding at the same rate every year until 2002 and years following, when the GDP had a spike. This spike lasted until 2008 where the economy dropped having recession for about 2 years and rose back in about 2011/2012. This return to normal rates then dropped again in 2013 where GDP of Norway then dropped severely. This is an example of a business cycle showing expansions and then some contractions. The reason behind Norway’s GDP to drop is due to the drop of oil prices. Norway is a large petroleum exporting nation and when the prices of those drop, their biggest industry begins to lose money, making less profit and therefore making the GDP in Norway to drop. This seems to be the only reason why the economic GDP in Norway may have dropped between 2007 to 2017.
